
Ferritin
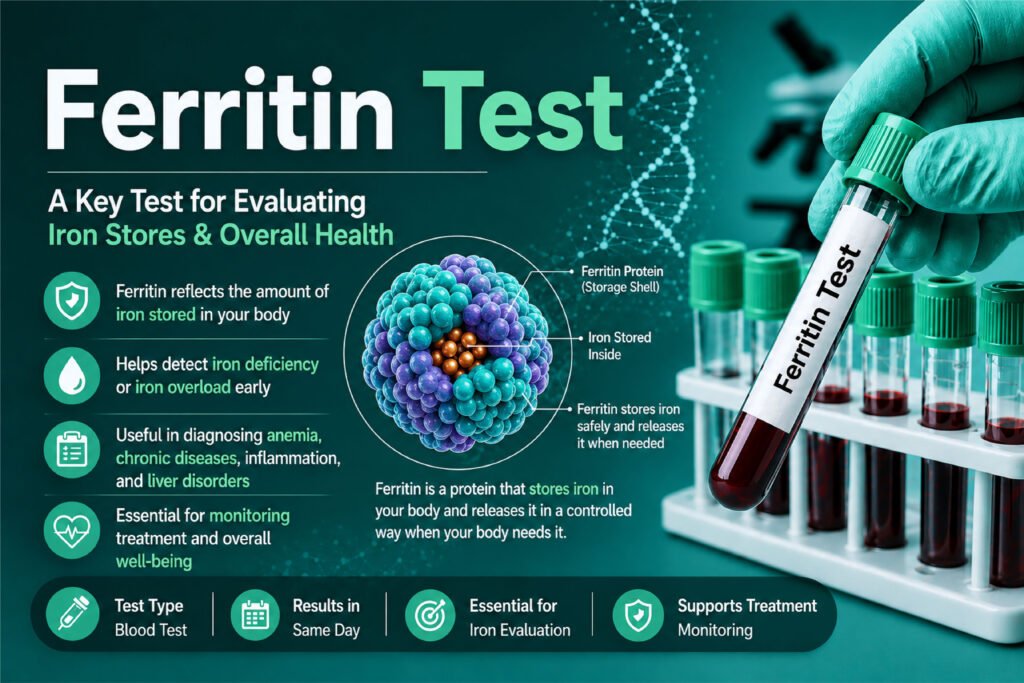
Table of Contents
Definition
Ferritin is a ubiquitous, high-molecular-weight intracellular protein designed to store iron in a non-toxic, bioavailable form. Free iron ions (Fe^+2 and Fe^+3) are highly reactive. They catalyze the formation of damaging free radicals via the Fenton and Haber-Weiss reactions, inducing severe cellular oxidative stress.
Clinical Significance
In the clinical laboratory, serum ferritin serves as a complex metabolic dynamic indicator that spans hematology, hepatology, rheumatology, and oncology.
The clinical significance of serum ferritin can be systematically evaluated across distinct physiological and pathological states.
1. The Early Sentinel of Absolute Iron Deficiency
In absolute iron deficiency, body iron stores are completely exhausted. Serum ferritin is the premier diagnostic tool because it is the first laboratory marker to decline during progressive iron depletion.
The progression toward Iron Deficiency Anemia (IDA) occurs in three distinct clinical stages:
1.Stage 1: Iron Depletion (Latent Deficiency):Bone Marrow Stores Cleared.
Iron mobilization from hepatocyte and macrophage reserves exceeds dietary intake. Serum ferritin drops below 30 ng/mL, but serum iron, transferrin saturation (TSAT), and hemoglobin remain entirely normal. The patient is asymptomatic, but vulnerable.
2.Stage 2: Iron-Deficient Erythropoiesis:Deficient Hemoglobin Synthesis.
Storage pools are empty (Ferritin < 15ng/mL). Available serum iron drops, and Total Iron-Binding Capacity (TIBC) increases as the liver upregulates transferrin production. Erythroid progenitors lack sufficient iron for heme synthesis, causing zinc protoporphyrin to rise, though hemoglobin levels remain just above the microcytic anemia threshold.
3.Stage 3: True Iron Deficiency Anemia:Frank Microcytic, Hypochromic Anemia.
Hemoglobin drops below normal clinical limits. The peripheral blood smear reveals classic microcytosis (low MCV) and hypochromia (low MCH). Ferritin is at its absolute nadir, frequently falling under 10 ng/mL.
Critical Diagnostic Rule: A serum ferritin concentration of less than 15 ng/mL is 100% specific for absolute iron deficiency. There are no false-low ferritins in clinical medicine.
2. Hyperferritinemia: The Challenge of Elevated Storage Pools
When a laboratory report shows elevated serum ferritin (hyperferritinemia), clinicians must immediately differentiate between true iron overload and reactive elevations caused by cellular damage or inflammation.
A. True Iron Overload (True Tissue Toxicity)
Excess systemic iron over-saturates the safe storage capacity of apoferritin, leading to the formation of unbonded Non-Transferrin-Bound Iron (NTBI) and Labile Plasma Iron (LPI). These reactive molecules deposit heavily inside parenchymal tissues, inducing severe organ damage via lipid peroxidation and tissue fibrosis.
Hereditary Hemochromatosis (HH): Mutations in the HFE gene (principally C282Y homozygosity) disrupt the synthesis of hepcidin, the master regulatory hormone of iron export. Without hepcidin control, enterocytes constantly absorb iron regardless of systemic levels. Ferritin often exceeds 1,000 ng/mL, threatening irreversible organic damage.
Transfusional Siderosis (Hemosiderosis): Patients with transfusion-dependent hemoglobinopathies (e.g., $\beta$-Thalassemia Major, severe Sickle Cell Disease) accumulate roughly 200 mg of elemental iron per packed red cell unit. Lacking an active physiological pathway to excrete iron, this extra load pools directly into systemic macrophages and tissue cells, driving serum ferritin into thousands of units.
B. Reactive & Structural Hyperferritinemia (No Iron Overload)
In these clinical syndromes, ferritin values are elevated despite normal or even low cellular iron reserves:
Acute and Chronic Liver Pathology: Hepatocytes hold the body’s highest concentrations of intracellular L-subunit ferritin. When hepatocytes undergo necrosis during acute viral hepatitis, toxic drug ingestion (e.g., acetaminophen overdose), or advanced Non-Alcoholic Fatty Liver Disease (NAFLD), the structural cell walls rupture. This dumps intracellular tissue ferritin directly into plasma, causing a massive serum spike that mimics extreme iron overload.
Metabolic Syndrome & Dysmetabolic Hyperferritinemia: Patients presenting with obesity, type 2 diabetes, hyperlipidemia, and hypertension often demonstrate elevated serum ferritin with normal transferrin saturation. This is driven by chronic, low-grade adipose and hepatic tissue inflammation upregulating baseline ferritin synthesis.
3. The Inflammatory Dynamic: An Acute-Phase Reactant
Serum ferritin is a highly responsive positive acute-phase reactant. During systemic acute or chronic inflammatory stress, pro-inflammatory cytokines (specifically IL-1, IL-6, and TNF-alpha) interact with upstream regulatory regions of the FER1 and FER2 genes to aggressively accelerate ferritin transcription.
Evaluating hyperferritinemia systematically requires looking at the combined presentation of inherited versus acquired clinical pathways:
Extreme Hyperferritinemia (The “Hyperferritinemic Syndromes”)
When serum ferritin spikes to exceptional levels (> 5,000 ng /mL up to > 100,000 ng/mL), it shifts from a general inflammatory indicator to a defining diagnostic marker for severe immunopathology:
Hemophagocytic Lymphohistiocytosis (HLH): A life-threatening hyper-inflammatory state driven by uncontrolled T-cell and macrophage activation. Macrophages begin aggressively phagocytosing the body’s own erythrocytes and leukocytes. A serum ferritin value greater than 500 ng/mL is an official HLH diagnostic criterion, but values in practice routinely exceed 10,000 ng/mL, serving as a direct marker of disease severity.
Adult-Onset Still’s Disease (AOSD): A systemic inflammatory condition characterized by spiking fevers, salmon-pink skin rashes, and severe arthralgia. Up to 70% of active AOSD cases exhibit serum ferritin elevations exceeding 3,000 ng/mL. Additionally, there is a signature drop in the percentage of glycosylated ferritin (< 20%), which helps differentiate AOSD from other systemic inflammatory responses.
4. Onco-Ferritin Dynamics: A Marker of Malignancy
Ferritin levels serve as an important clinical adjunct marker in oncology for monitoring tumor burden, staging, and therapeutic response.
Active Tumor Secretion: Many malignant cell lineages—particularly neuroblastomas, Hodgkin’s and non-Hodgkin’s lymphomas, pancreatic adenocarcinomas, and breast carcinomas—directly synthesize and secrete altered heavy-chain-rich ferritin into circulation.
Clinical Utility: While poor specificity makes serum ferritin unsuitable as a primary screening test for cancer, serial measurements are valuable for monitoring therapeutic response. A sharp post-chemotherapy drop in ferritin indicates effective tumor cytoreduction, while a subsequent spike serves as an early indicator of clinical recurrence.
Methods & Principle
In the clinical diagnostics laboratory, quantifyng serum ferritin requires highly sensitive and precise analytical platforms. Because ferritin circulates at nanogram-per-milliliter levels (ng/mL), assays must leverage targeted immunological specificity combined with powerful signal amplification.
The primary methodologies, physical principles, and procedural workflows used to measure serum ferritin are detailed below.
1. Chemiluminescent Immunoassay (CLIA)
Chemiluminescent Immunoassay is the most widely utilized methodology on high-throughput automated analyzers. It offers excellent analytical sensitivity, a wide dynamic range, and minimal turnaround times.
The Assay Principle
CLIA utilizes a non-competitive, two-site sandwich immunoassay framework. The core principle relies on a chemical reaction that releases energy in the form of light (luminescence) when an emission substrate interacts with an excited-state molecule. Unlike fluorescence, CLIA requires no external excitation light source, which completely eliminates background scattering noise.
Procedural Steps & Mechanics
1.Step 1: Immune Complex Formation:Solid-Phase Capture.
The patient’s serum sample is incubated with two distinct reagents: a solid-phase vehicle (typically paramagnetic microparticles coated with monoclonal anti-ferritin antibodies) and a tracer reagent (monoclonal anti-ferritin antibodies conjugated to a chemiluminescent molecule like acridinium ester). The serum ferritin acts as an antigen bridge, forming a sandwich complex:
[Magnetic Bead]–[Capture Ab]–[Ferritin Antigen]–[Tracer Ab-Acridinium Ester].
2.Step 2: Washing Phase:Magnetic Separation.
The reaction cuvette enters a magnetic field. The paramagnetic microparticles (holding the bound ferritin sandwich) are locked against the cuvette wall by an external magnet. An automated wash fluid aspiration removes all unbound tracer molecules and matrix interferents, preventing non-specific background signals.
3.Step 3: Signal Activation & Oxidation:Signal Induction.
The analyzer injects trigger reagents into the cuvette—typically an acidic solution of hydrogen peroxide (H2O2) followed by an alkaline sodium hydroxide (NaOH) solution. This rapid pH shift causes the acridinium ester to undergo oxidation, releasing an unstable intermediate that emits light flashes at a wavelength of approximately 430 nm as it drops back to ground state.
4.Step 4: Photodetector Measurement:Photomultiplier Quantitation.
A photomultiplier tube (PMT) or a solid-state optical detector counts the emitted photons, recording them as Relative Light Units (RLUs). The concentration of serum ferritin is directly proportional to the intensity of the light signal generated, which is calculated using a multi-point calibration curve stored in the instrument software.
2. Enzyme-Linked Immunosorbent Assay (ELISA)
While largely superseded by CLIA in large hospital labs, microplate ELISA remains a foundational technique in research, reference laboratories, and low-resource settings due to its cost-efficiency and reliable accuracy.
The Assay Principle
Like CLIA, ferritin ELISA relies on a sandwich immunoassay configuration. However, instead of using a self-luminescing chemical tag, the detection antibody is conjugated to an active enzyme catalyst. When an appropriate chromogenic substrate is added, this enzyme drives a catalytic color change.
Technical Parameters
Solid Phase: 96-well polystyrene microtiter plates pre-coated with high-affinity anti-ferritin antibodies.
Enzyme Conjugate: Typically Horseradish Peroxidase (HRP) or Alkaline Phosphatase (AP).
Chromogenic Substrate: Tetramethylbenzidine (TMB) for HRP systems.
Stop Solution: A strong acid (e.g., 1M or 2M H2SO4) that denatures the enzyme, halting the catalytic conversion and stabilizing the color change.
Optical Readout: Measured via a microplate spectrophotometer reader at 450 nm (for TMB). The concentration of ferritin is directly proportional to the optical density (OD) value.
3. Latex-Enhanced Immunoturbidimetry
This fluid-phase methodology is designed for rapid deployment on standard, open-system clinical chemistry analyzers, avoiding the need for dedicated immunoassay modules.
The Assay Principle
Immunoturbidimetry measures the reduction in transmitted light caused by the formation of insoluble immune aggregates in solution.
Because the ferritin molecule is small, standard antibody-antigen lattices do not scatter light efficiently enough for high-sensitivity tracking. To circumvent this limitation, specific anti-ferritin antibodies are covalently bound to uniform latex microparticles.
When serum containing ferritin is mixed with the reagent, the multi-valent antigen cross-links the latex spheres, generating rapid, macroscopic agglutination.
Optical Dynamics
The analyzer directs a light beam through the reaction cuvette (typically at a wavelength between 500 nm and 600 nm). As agglutination progresses, the solution’s turbidity increases, scattering the incident light.
The photodetector tracks the decrease in transmitted light intensity. The rate of change in absorbance is calculated and matched against a standard curve. The concentration of ferritin is directly proportional to the change in absorbance over a specified time interval.
Technical Comparison of Methodologies
| Feature / Metric | Chemiluminescent Immunoassay (CLIA) | Enzyme-Linked Immunosorbent Assay (ELISA) | Latex-Enhanced Immunoturbidimetry |
| Analytical Sensitivity | Excellent (< 0.5 ng/mL) | Good (1.0 – 2.0 ng/mL) | Moderate (5.0 ng/mL) |
| Dynamic Range | Extremely Wide (0.5 – 2,000 ng/mL) | Moderate (5 – 1,000 ng/mL) | Narrower (5 – 500 ng/mL) |
| Signal Relationship | Directly Proportional to RLU | Directly Proportional to OD | Directly Proportional to Absorbance |
| Throughput Capacity | Very High (Automated) | Batch Processing (Manual/Semi-automated) | High (Integrated into core chemistry) |
| Main Interference Risk | Hook Effect, Heterophilic Antibodies | Edge effects, incomplete plate washing | Lipemia, rheumatoid factor cross-reaction |
Specimen Requirements
In the clinical laboratory, pre-analytical variables account for up to 60–70% of all diagnostic errors. To guarantee accurate serum ferritin quantification, strict adherence to specimen collection, processing, and storage protocols is mandatory.
Below are the detailed specimen requirements, collection criteria, and specific pre-analytical interferents for serum ferritin testing.
1. Specimen Collection and Tube Types
Serum is the preferred and most widely validated specimen type for ferritin assays across major automated platforms (e.g., Roche Elecsys, Abbott Alinity, Beckman Coulter Access). However, specific plasma formulations are acceptable alternatives on several systems.
Primary Specimen Choices
| Tube Top Color | Additive / Matrix | Evaluation Status | Clinical Rationale & Laboratory Notes |
| Red Top | Plain Clot Activator (No Gel) | Preferred / Standard | Yields true serum. Minimizes any risk of chemical interference from separator gels during long-term storage or specialized research assays. |
| Gold / Tiger Top | Serum Separator Tube (SST) with Clot Activator and Gel | Excellent for Routine Labs | Highly preferred for high-throughput automation. The inert barrier gel isolates serum from cells after centrifugation, allowing direct sampling from the primary collection tube. |
| Light Green Top | Plasma Separator Tube (PST) with Lithium Heparin and Gel | Acceptable / Platform-Dependent | Provides plasma. Often utilized in emergency or rapid-turnaround settings because it eliminates the 30-minute clotting wait time. Note: Must verify platform compatibility. |
Strictly Banned Specimen Types
EDTA Plasma (Lavender Top): EDTA acts as a powerful chelator that binds divalent metal ions. Because certain automated immunoassays rely on metallic cofactors (e.g., alkaline phosphatase conjugates requiring Zn^2+ or Mg^2+), EDTA will cause significant analytical suppression, yielding falsely low ferritin results.
Sodium Citrate Plasma (Light Blue Top): The liquid anticoagulant induces a significant dilution effect (typically 1:9), distorting the true quantitative value of circulating nanoproteins.
2. Patient Preparation and Phlebotomy Protocols
To ensure the specimen accurately reflects the patient’s baseline iron stores, several pre-analytical variables must be controlled prior to needle insertion.
Patient Factors
Fasting Status: A strict fast is not mandatory for a standalone serum ferritin test. However, because ferritin is routinely ordered as part of a comprehensive iron panel (alongside Serum Iron and Total Iron-Binding Capacity), a 12-hour fast is highly recommended. Dietary iron intake can rapidly skew serum iron levels, altering transferrin saturation calculations.
Diurnal Variation: Circulating iron peaks in the early morning. While ferritin concentrations remain relatively stable throughout the day compared to highly volatile serum iron levels, morning collection (07:00 AM – 10:00 AM) is standard practice to maintain iron panel uniformity.
Avoidance of Interferences: The patient must refrain from taking iron supplements or multi-vitamins containing iron for at least 24 hours prior to blood collection.
Phlebotomy Technique
Avoid Prolonged Tourniquet Stasis: Keeping the tourniquet tied for longer than 60 seconds causes localized hemoconcentration. This falsely elevates concentration values for large molecules and protein-bound analytes, including ferritin.
Order of Draw Compliance: To avoid cross-contamination of tube additives, phlebotomists must strictly adhere to the standard order of draw:
[Culture Bottles] ➔ [Light Blue / Citrate] ➔ [Red / Gold / SST] ➔ [Green / Heparin] ➔ [Lavender / EDTA]
3. Post-Collection Processing and Specimen Stability
Once drawn, specimens must be handled carefully to preserve the integrity of the glycosylated apoferritin shell.
Centrifugation Requirements
1.Complete Clotting Window:30–60 Minutes at Room Temperature.
Allow plain red or SST tubes to stand vertically for a minimum of 30 minutes at room temperature (20–25°C). This ensures complete fibrin clot formation. Centrifuging prematurely can leave latent fibrin strands in the serum, which can later clog sample probes or mimic immune complexes on automated analyzers.
2.Standard Centrifugation Run:10 Minutes at 1000–1200 x g.
Spin the sample in a balanced, temperature-controlled centrifuge (preferably at 20–25°C) for 10 minutes at a Relative Centrifugal Force (RCF) of 1000 to 1200 x g. Ensure the centrifuge comes to a complete, unassisted stop to prevent disturbance of the gel or cell layer.
3.Serum Isolation (Aliexpressing):Immediate Separation for Non-Gel Tubes.
For plain red-top tubes lacking a barrier gel, immediately pipette the cell-free serum into a clean, properly labeled polypropylene aliquot transport tube. For SST or PST tubes, verify that the barrier gel has completely formed a solid layer separating the cells from the fluid phase.
Storage Stability Metrics
Ferritin is a highly stable analyte once isolated from cellular components, making it well-suited for batched testing or retrospective reference research.
Room Temperature (20 C to 25 C): Stable for up to 7 days.
Refrigerated (2 C to 8 C): Stable for up to 14 days.
Frozen (-20 C or lower): Stable for 6 to 12 months.
Important Storage Rule: Avoid repeated freeze-thaw cycles. Multiple shifts in phase cause thermal stress that can denature the 24-subunit protein shell, leading to unpredictable under-recovery of the analyte during immunoassay analysis.
4. Pre-Analytical Interferents and Rejection Criteria
Samples demonstrating any of the following criteria fail quality control validation and must be flagged for recollection.
1. Hemolysis (The Red Cell Trap)
The Issue: Erythrocytes contain high concentrations of intracellular H-subunit ferritin.
The Impact: Even mild or moderate hemolysis releases this cellular ferritin directly into the serum matrix, leading to a false elevation of measured serum ferritin.
Action: Reject samples with a visible hemolytic index (typically hemoglobin concentrations >100mg/dL).
2. Lipemia and Turbidity
The Issue: High concentrations of chylomicrons and VLDL molecules create severe sample turbidity.
The Impact: This is especially problematic for latex-enhanced immunoturbidimetric assays, where lipid particles scatter the light beam and mimic antigen-antibody aggregates, yielding highly inaccurate, elevated results.
Action: If a redraw is impossible, lipemic samples must be cleared using a high-speed microcentrifuge or a specific lipid-clearing reagent before testing.
3. Recent Radioactive or Contrast Exposure
The Issue: Patients undergoing active diagnostic imaging may have circulating tracer isotopes or micro-doses of biotin.
The Impact: Many modern chemiluminescent platforms rely on a biotin-streptavidin binding mechanism for signal capture. High doses of exogenous biotin compete with the assay reagents, resulting in falsely depressed or elevated readings depending on the specific assay design.
Reference Ranges & Clinical Interpretations
To correctly report and interpret serum ferritin, clinical laboratory professionals must look past basic broad normal ranges. Because ferritin tracks directly with physiological aging, hormonal changes, and acute systemic inflammation, its “normal” value must be stratfied by age, sex, and underlying clinical contexts.
1. Standard Reference Ranges
Reference intervals for serum ferritin differ based on age and sex, primarily due to variations in menstruation, pregnancy, and development. While individual instrumentation lines (e.g., Roche, Beckman, Siemens) vary slightly, the standard consensus reference ranges are outlined below:
| Patient Population | Standard Reference Range (ng/mL or μg/L) | Critical Clinical Thresholds |
| Adult Men | 20 – 300 ng/mL | < 30 ng/mL (Deficient) > 300 ng/mL (Elevated) |
| Adult Women (Premenopausal) | 15 – 150 ng/mL | < 15 – 30 ng/mL (Deficient) > 150 ng/mL (Elevated) |
| Adult Women (Postmenopausal) | 20 – 300 ng/mL | Follows standard male ranges due to cessation of menstrual blood loss. |
| Newborns (0 – 2 months) | 200 – 600 ng/mL | Highly elevated due to massive neonatal erythropoiesis and maternal iron transfer. |
| Children (2 – 12 years) | 10 – 140 ng/mL | Lower baseline reserves due to high consumption by active muscular and skeletal growth. |
2. Clinical Interpretation Framework
When evaluating a ferritin result, the value falls into one of four distinct diagnostic categories.
Category A: Severe / Absolute Depletion (< 15 ng/mL)
Interpretation: Diagnostic of absolute iron deficiency. Bone marrow iron reserves are completely exhausted.
Clinical Presentation: If Hemoglobin is normal, the patient has latent iron deficiency. If Hemoglobin is decreased (< 12.0 g/dL for women, < 13.0 g/dL for men), it confirms microcytic hypochromic iron deficiency anemia.
Peripheral Blood Smear: Microcytosis (small red cells) and hypochromia (enlarged central pallor) alongside specialized cells like elliptocytes (pencil cells).
Category B: Borderline / Mild Depletion (15 – 30 ng/mL)
Interpretation: Highly suggestive of early-stage iron deficiency, or absolute deficiency masked by mild, subclinical inflammatory processes.
Clinical Action: According to modern gastroenterology and hematology guidelines, a threshold of < 30 ng/mL is utilized to diagnose iron deficiency in symptomatic adults, even if the formal laboratory lower limit is set to 15 or 20 ng/mL.
Category C: The Inflammatory “Gray Zone” (30 – 100 ng/mL)
Interpretation: This is the most complex clinical zone. A value in this range is technically “normal” by standard criteria, but cannot rule out iron deficiency if the patient has a concurrent inflammatory condition (e.g., Chronic Kidney Disease, Heart Failure, Rheumatoid Arthritis, or active infection).
Diagnostic Resolution: If a patient’s C-Reactive Protein (CRP) or ESR is elevated, a ferritin value up to 100 ng/mL can still mean they have underlying tissue iron deficiency. In these cases, look at the Transferrin Saturation (TSAT). If the TSAT is less than 20%, it indicates functional iron deficiency.
Category D: Pathological Hyperferritinemia (> 300 ng/mL)
Interpretation: High levels indicate either systemic iron overload, severe inflammation, or tissue damage.
Differential Evaluation Protocol:
If TSAT is elevated (> 45 – 50%): Suggests true iron overload. Order genetic testing for Hereditary Hemochromatosis (HFE mutations).
If TSAT is normal/low (< 45%): Indicates reactive hyperferritinemia. The elevation is driven by an acute-phase response, liver cell necrosis, metabolic syndrome, or malignancy rather than true iron overload.
3. Advanced Diagnostic Thresholds in Special Co-Morbidities
To manage complex systemic illnesses, specific clinical specialties utilize customized, elevated ferritin thresholds to guide therapeutic intervention.
Chronic Kidney Disease (CKD) ──> Target Ferritin: 100 - 500 ng/mL (Triggers IV Iron Therapy if lower)
Chronic Heart Failure (CHF)  ──> Absolute Deficiency Definition: < 100 ng/mL (Or 100-300 ng/mL if TSAT < 20%)
Chronic Kidney Disease (CKD): Patients on dialysis experience constant blood loss and suppressed erythropoietin production. To ensure their bone marrow has enough iron to respond to Erythropoiesis-Stimulating Agents (ESAs), nephrology guidelines state that iron deficiency is present when ferritin is less than 100 ng/mL (for non-dialysis CKD) or less than 200 ng/mL (for dependent dialysis patients).
Chronic Heart Failure (CHF): Intracellular iron is a required cofactor for mitochondrial myoglobin energy production in cardiac muscle. Clinical trials demonstrate that treating iron deficiency improves cardiac function. In CHF patients, iron deficiency is defined as a ferritin level less than 100 ng/mL, or 100 to 300 ng/mL if the TSAT is less than 20%.
Quick Stats
| Feature | Details | Critical Lab Insights |
| Test Type | Clinical Chemistry / Immunochemical Marker | The premier marker for total body iron stores. It serves as the clinical gatekeeper to differentiate between absolute iron deficiency and functional iron sequestration. |
| Sample Type | Serum (Preferred) or Plasma | Gold Top (SST) or Plain Red Top are standard. Lithium Heparin (Green Top) is platform-dependent. EDTA (Lavender Top) is strictly prohibited as it chelates assay cofactors. |
| Analytical Method | Automated Sandwich Immunoassay | Utilizing Chemiluminescent Immunoassay (CLIA) or Latex-Enhanced Immunoturbidimetry. Relies on two distinct antibodies trapping the ferritin heteropolymer. |
| Primary Metric | Nanograms per Milliliter (ng/mL or ug/L) | A drop in concentration directly mirrors depleted iron stores; 1 ng/mL of serum ferritin correlates to approximately 8 – 10 mg of storage iron. |
| Fasting Required? | Recommended (12-Hour Fast) | Not mandatory for a standalone test, but highly recommended because it is routinely bundled into a full iron panel where dietary intake heavily skews serum iron and TSAT. |
| Standardization | WHO 3rd International Standard (80/578) | Calibrated against liver-derived human ferritin standards to ensure inter-laboratory harmony across varying automated diagnostic platforms. |
| Turnaround Time | 30–60 Minutes | High-throughput automated CLIA modules process samples rapidly. Includes a mandatory pre-analytical 30-minute clot window for non-plasma tubes. |
| Biological Half-life | ~50 Hours | Circulates reliably but undergoes rapid upregulation during cellular damage or under the direct influence of pro-inflammatory cytokines (IL-6, TNF-alpha). |
| Normal Range | Men: 20 – 300 ng/mL
Women: 15 – 150 ng/mL | Premenopausal intervals are significantly lower due to cyclic menstrual blood loss. Postmenopausal women normalize to match standard male reference intervals. |
| Diagnostic Cut-offs | Absolute Deficiency: < 15 ng/mL
Inflammation Threshold: < 100 ng/mL | A value < 15 ng/mL is 100% specific for iron deficiency. In chronic inflammatory conditions (CKD/CHF), iron deficiency is redefined up to < 100 ng/mL. |
| Key Limitation | Acute-Phase Masking | As a positive acute-phase reactant, elevated systemic inflammation falsely elevates ferritin, completely hiding an underlying absolute iron deficiency state. |
FAQs
Q1: Why is EDTA plasma strictly prohibited for serum ferritin testing, and what should a tech do if one is inadvertently run?
A: EDTA is a powerful anticoagulant that works by chelating divalent cations (such as Ca^2+, Mg^2+, and Zn^2+). Many automated immunoassay platforms utilize enzyme conjugates—like Alkaline Phosphatase (ALP)—that require zinc or magnesium ions as essential structural cofactors to catalyze the chemiluminescent signal. If EDTA plasma is used, it strips these metal ions from the assay reagents, resulting in a severe suppression of the signal and a falsely depressed ferritin result. If an EDTA sample is accidentally run, the result must be suppressed, the sample rejected, and a new sample (SST/Serum) requested.
Q2: What is the “Hook Effect” in ferritin testing, how does it manifest, and how do you resolve it?
A: The hook effect (or prozone phenomenon) occurs in non-competitive sandwich immunoassays when an analyte is present in extreme excess (e.g., ferritin levels >10,000 ng/mL in cases of HLH or massive iron overload). The overwhelming number of ferritin molecules saturates both the solid-phase capture antibodies and the fluid-phase detection antibodies individually, preventing them from forming the necessary “sandwich” complex. As a result, the unlinked detection antibodies are washed away, yielding a falsely low or near-normal result.
Laboratory Resolution: If a patient’s clinical picture suggests severe iron overload or macrophage activation, but the lab analyzer reports a normal or mildly elevated ferritin level, the medical laboratory scientist must perform a manual or automated dilution (e.g., 1:10 or 1:100) using the instrument’s verified diluent. If the diluted sample yields a significantly higher calculated result than the neat sample, the hook effect is confirmed.
Q3: If a patient has a serum ferritin of 85 ng/mL (normal range) but a transferrin saturation (TSAT) of 12%, do they have iron deficiency?
A: Yes, this is highly indicative of functional iron deficiency or iron deficiency masked by inflammation. Ferritin is a positive acute-phase reactant. If the patient has an underlying chronic infection, malignancy, or autoimmune disease, pro-inflammatory cytokines upregulate ferritin synthesis, falsely driving a deficient baseline into the “normal” gray zone (30 – 100 ng/mL). However, the low TSAT (<20%) reveals that actual circulating iron is severely restricted. To definitively confirm tissue iron deficiency in this scenario, labs should evaluate the Soluble Transferrin Receptor (sTfR) or calculate the sTfR-Ferritin Index , as sTfR expression is unaffected by systemic inflammation.
Q4: How does severe hemolysis affect serum ferritin results, and what is the mechanism?
A: Visible hemolysis introduces significant positive pre-analytical interference. While serum ferritin consists mostly of light-chain (L-subunit) apoferritin, human erythrocytes (RBCs) contain highly concentrated reservoirs of intracellular heavy-chain (H-subunit) ferritin. When RBCs rupture due to poor phlebotomy technique or prolonged storage, this intracellular ferritin spills directly into the serum matrix. Automated anti-ferritin antibodies cross-react with these liberated H-subunits, creating a false, analytical elevation of the reported serum ferritin concentration. Samples exceeding the instrument’s validated hemolytic index threshold must be rejected.
Q5: Why do postmenopausal women have higher standard reference ranges for ferritin than premenopausal women?
A: The reference interval for serum ferritin directly reflects total body iron stores. Premenopausal women lose roughly 30 to 40 mg of elemental iron monthly through menstrual bleeding, alongside significant iron depletion during pregnancy and lactation. This continuous physiological loss keeps baseline iron reserves—and consequently, serum ferritin levels—relatively low (15 – 150 ng/mL). Following menopause, the cessation of menstrual blood loss stops this chronic iron excretion. Over the subsequent 3 to 5 years, dietary iron absorption outpaces loss, causing systemic iron stores to slowly accumulate until they match the reference profiles of adult men (20 – 300 ng/mL).