
Lipid Profile
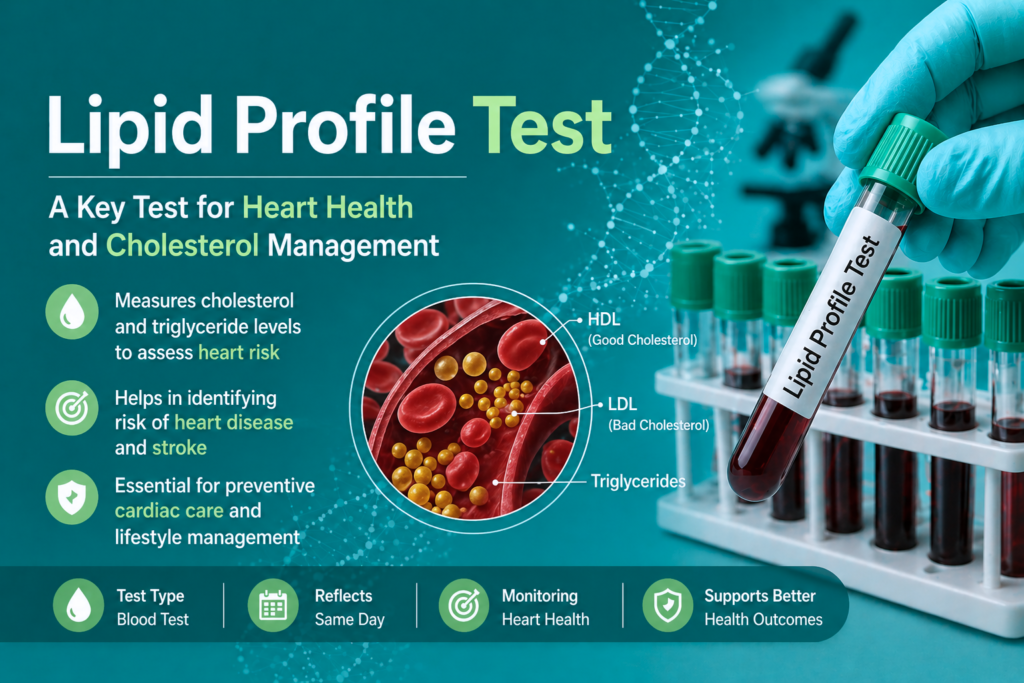
Table of Contents
Definition
A lipid profile (or lipid panel) is a cluster of blood tests used to measure the amount of specific fat molecules—lipids—in the blood. These lipids are transported in the plasma by lipoproteins.
Primary Parameters Measured:
Total Cholesterol (TC): The overall amount of cholesterol in the blood.
High-Density Lipoprotein (HDL-C): Often called “good cholesterol” as it transports cholesterol back to the liver.
Low-Density Lipoprotein (LDL-C): Known as “bad cholesterol” because it contributes to plaque buildup in arteries (atherosclerosis).
Triglycerides (TG): A type of fat used for energy storage; elevated levels are linked to pancreatitis and heart disease.
Clinical Significance
In the clinical laboratory, the lipid profile is the primary tool for determining a patient’s atherogenic risk. Beyond just numbers, these results tell a story of metabolic health, vascular integrity, and potential systemic inflammation.
1. Atherosclerosis and Coronary Artery Disease (CAD)
The most critical significance of a lipid panel is its predictive value for Atherosclerosis.
LDL-C (The Culprit): Low-Density Lipoprotein carries cholesterol to the peripheral tissues. When levels are high, LDL particles can infiltrate the arterial wall, undergo oxidation, and be engulfed by macrophages to form “foam cells.” This is the foundational step of plaque formation.
HDL-C (The Protector): High-Density Lipoprotein facilitates Reverse Cholesterol Transport, picking up excess cholesterol from the tissues and vessel walls and returning it to the liver for excretion. A low HDL level is a strong independent risk factor for myocardial infarction (heart attack).
2. Triglycerides and Pancreatitis
While often associated with heart disease, significantly elevated triglycerides (Hypertriglyceridemia) pose an acute risk to the pancreas.
Mild to Moderate (150–499 mg/dL): Linked to metabolic syndrome and increased cardiovascular risk.
Severe (>1000 mg/dL): This is a medical emergency. Extremely high TG levels lead to the release of free fatty acids that are toxic to pancreatic cells, potentially triggering Acute Pancreatitis.
3. Metabolic Syndrome (Syndrome X)
The lipid profile is a diagnostic pillar for Metabolic Syndrome. This is not a single disease but a cluster of conditions that occur together, increasing the risk of heart disease, stroke, and type 2 diabetes. A patient is often flagged if they present with:
Triglycerides >150 mg/dL.
HDL-C < 40 mg/dL (in men) or < 50 mg/dL (in women).
Elevated blood pressure and fasting glucose.
4. Dyslipidemia and Genetic Disorders
Detailed lipid analysis helps clinicians differentiate between lifestyle-induced issues and genetic predispositions:
Familial Hypercholesterolemia (FH): Characterized by extremely high LDL levels from birth due to a defect in the LDL receptor. These patients may present with Xanthomas (fatty deposits under the skin or tendons).
Secondary Dyslipidemia: Results can also point toward underlying non-cardiac conditions such as:
Hypothyroidism: Often causes elevated Total Cholesterol and LDL.
Nephrotic Syndrome: Leads to increased synthesis of lipoproteins by the liver.
Chronic Liver Disease: May result in significantly low cholesterol levels (Hypocholesterolemia).
5. Monitoring Therapeutic Efficacy
For laboratory professionals, the lipid profile is essential for longitudinal patient care.
Statin Therapy: Monitoring LDL-C helps clinicians titrate statin dosages to reach “target” levels based on the patient’s specific risk category.
Fibrates and Omega-3s: Used specifically to lower high triglyceride levels.
Summary for the Diagnostic Index
| Condition | Primary Lipid Finding | Clinical Implication |
| Atherosclerosis | High LDL, Low HDL | Risk of Myocardial Infarction / Stroke |
| Acute Pancreatitis | TG > 1000 mg/dL | Inflammatory emergency; Lipemic serum |
| Diabetes Mellitus | High TG, Low HDL | Accelerated vascular complications |
| Cholestasis | High Total Cholesterol | Impaired bile flow (Obstructive Jaundice) |
Methodology & Principle
The clinical laboratory, lipid analysis has evolved from complex chemical extractions to highly specific, automated enzymatic assays. Understanding the underlying biochemistry of these reactions is essential for troubleshooting and ensuring analytical quality.
1. Total Cholesterol: Enzymatic Endpoint Method
The most common method for measuring Total Cholesterol is the Allain et al. enzymatic method, which utilizes a series of coupled reactions.
The Principle:
Hydrolysis: Cholesterol esters are broken down into free cholesterol and fatty acids by the enzyme Cholesterol Esterase (CE).
Oxidation: Free cholesterol is oxidized by Cholesterol Oxidase (CHOD) to cholest-4-en-3-one and Hydrogen Peroxide (H2O2).
Color Development (Trinder Reaction): In the presence of Peroxidase (POD), the H2O2 reacts with 4-aminoantipyrine and phenol to form a red-colored quinoneimine dye.
Measurement: The intensity of the red color is directly proportional to the cholesterol concentration, measured spectrophotometrically (typically at 500–540 nm).
2. Triglycerides: Enzymatic Colorimetric Method (GPO-PAP)
Triglyceride measurement typically follows the Glycerol Phosphate Oxidase (GPO) method.
The Principle:
Lipolysis: Triglycerides are hydrolyzed by Lipase into glycerol and fatty acids.
Phosphorylation: Glycerol is phosphorylated by Glycerol Kinase (GK) in the presence of ATP to form Glycerol-3-Phosphate.
Oxidation: Glycerol-3-Phosphate is oxidized by Glycerol Phosphate Oxidase (GPO) to produce Dihydroxyacetone phosphate and Hydrogen Peroxide (H2O2).
Color Development: Similar to the cholesterol method, H2O2 undergoes a Trinder reaction to form a colored chromogen.
Analytical Note: “Endogenous glycerol” in the patient’s sample can cause a slight overestimation of triglycerides. Most modern automated analyzers perform a “glycerol blanking” step to correct for this.
3. HDL-C: Homogeneous Direct Method
Historically, HDL was measured using precipitation (where non-HDL fractions were clumped together and centrifuged). Today, we use Direct (Homogeneous) Methods that don’t require manual separation.
The Principle:
These methods use specific detergents or antibodies to “mask” or block the non-HDL lipoproteins (LDL, VLDL, and Chylomicrons).
Step 1: A specific reagent (Polyethylene glycol or antibodies) inhibits the reaction of cholesterol in non-HDL particles.
Step 2: A detergent selectively solubilizes HDL particles so that the enzymatic reaction (described in the Total Cholesterol section) can occur only on the HDL fraction.
4. LDL-C: Calculated vs. Direct Measurement
A. The Friedewald Calculation
As established, LDL is frequently calculated using the formula:
Units in mg/dL. For mmol/L, use (TG / 2.22).
Limitations:
It assumes a constant TG:VLDL ratio of 5:1.
It is invalid if TG > 400 mg/dL.
It is inaccurate if the patient has Type III Hyperlipoproteinemia (presence of IDL).
B. Direct LDL (dLDL)
When triglycerides are high, the lab uses a homogeneous direct assay. Like the HDL method, this uses specific surfactants that protect HDL and VLDL while specifically solubilizing LDL so it can react with the cholesterol enzymes.
5. Interference and Technical Considerations
As a lab professional, you must be aware of factors that compromise result integrity:
Lipemia: High triglycerides cause light scattering (turbidity). This can falsely elevate spectrophotometric readings. Modern analyzers use Serum Indices (L-Index) to flag these samples.
Hemolysis: Significant hemolysis can interfere with the colorimetric reactions, often leading to falsely decreased results in some enzymatic assays.
Icterus (Bilirubin): High bilirubin levels can compete with the chromogen for hydrogen peroxide, potentially causing falsely low lipid values.
| Parameter | Method Name | Key Enzyme |
| Total Cholesterol | CHOD-PAP | Cholesterol Oxidase |
| Triglycerides | GPO-PAP | Glycerol Phosphate Oxidase |
| HDL / LDL | Direct Homogeneous | Specific Detergents/Polymer |
Specimen Requirements
In the clinical laboratory, the pre-analytical phase is where the majority of errors occur. For a lipid profile, strict adherence to collection protocols is vital because lipid levels are highly sensitive to physiological states, posture, and timing.
1. Patient Preparation (The Gold Standard)
To ensure the most accurate reflection of metabolic health, specific patient instructions are required:
Fasting Status: An 8–12 hour fast is traditionally required. During this time, the patient may consume only water.
Rationale: Postprandial (after-meal) samples show a significant rise in chylomicrons, which falsely elevates Triglyceride levels and invalidates the Friedewald calculation for LDL.
Exception: Recent clinical guidelines allow non-fasting samples for initial screening in low-risk patients, but fasting remains mandatory if TG > 400 mg/dL.
Dietary Habits: The patient should maintain their usual diet for at least two weeks prior to the test. Sudden weight loss or binge eating can lead to transient lipid fluctuations.
Alcohol Consumption: Patients should abstain from alcohol for 24 hours before the blood draw, as alcohol significantly increases triglyceride synthesis in the liver.
Medication: If possible, tests should be performed before the morning dose of lipid-altering medications, unless the clinician is monitoring the peak effect of a drug.
2. Specimen Collection Details
The quality of the sample starts at the venipuncture site.
Specimen Type: Serum or Plasma.
Serum (Plain Tube / Gel Activator): The preferred specimen in most clinical settings. Serum allows for a cleaner separation of lipoproteins.
Plasma (EDTA Tube): Often used in research or specialized lipidology. Note: EDTA plasma results are typically 3%–5% lower than serum results due to the osmotic shift of water from cells to plasma.
Container/Tube Top:
Gold Top (SST) or Red Top: For serum.
Lavender Top (EDTA): For plasma (if specified by the methodology).
Green Top (Heparin): Acceptable for some automated analyzers, but check manufacturer guidelines.
Posture During Collection: The patient should be seated for at least 5 minutes prior to the draw.
Clinical Pearl: Shifting from a standing to a supine (lying down) position can cause a 10%–15% decrease in lipid concentrations due to hemodilution.
3. Stability and Storage
Lipids and lipoproteins are relatively stable, but improper storage can lead to the degradation of enzymes or the aggregation of particles.
Processing: Blood should be allowed to clot completely (30–60 mins) and then centrifuged within 2 hours of collection.
Temperature Ranges:
Room Temperature (15–25°C): Not recommended for more than a few hours.
Refrigerated (2–8°C): Stable for up to 7 days. This is the standard for routine lab processing.
Frozen (-20°C): Stable for several weeks.
Deep Freeze (-70°C): Stable for months/years; required for longitudinal research studies.
Avoid Repeated Freeze-Thaw Cycles: This causes the denaturation of apolipoproteins and affects the accuracy of HDL and LDL measurements.
4. Rejection Criteria (Pre-Analytical Red Flags)
As a technologist, you must reject samples that compromise accuracy:
Severe Hemolysis: Hemoglobin interferes with the enzymatic colorimetric reactions, often leading to falsely low values.
Inadequate Fasting: If the serum appears extremely turbid/milky (lipemic) and the patient admits to eating, a re-draw is necessary.
Improper Labeling: Standard safety protocol.
Incorrect Tube Type: Using a citrate or fluoride tube can significantly interfere with enzyme activity used in the lipid assays.
5. Summary Table for Lab Technologists
| Factor | Requirement | Impact if Ignored |
| Fasting | 8–12 hours | Falsely elevated Triglycerides |
| Tube Type | SST (Gold) or Red Top | Chemical interference |
| Centrifugation | Within 2 hours | Potential for analyte degradation |
| Alcohol | Avoid for 24 hours | Acute spike in VLDL/TG |
| Hemolysis | Must be avoided | Spectrophotometric interference |
Reference Ranges & Clinical Interpretations
In medical diagnostics, interpreting a lipid profile requires moving beyond “normal vs. abnormal.” You must evaluate the atherogenic ratio and the patient’s overall metabolic state.
1. Standard Reference Ranges (NCEP ATP III Guidelines)
These ranges serve as the baseline for adult patients. Note that for pediatric patients or those with pre-existing heart disease, target levels are often significantly more stringent.
| Parameter | Category | Range (mg/dL) | Range (mmol/L) | Clinical Impact |
| Total Cholesterol | Desirable | < 200 | < 5.18 | Low risk for vascular events. |
| Borderline High | 200 – 239 | 5.18 – 6.18 | Lifestyle modification advised. | |
| High | >240 | >6.22 | High risk for CAD. | |
| LDL (Bad) | Optimal | < 100 | < 2.59 | Target for high-risk patients. |
| Above Optimal | 100 – 129 | 2.59 – 3.34 | Acceptable for low-risk individuals. | |
| High | 160 – 189 | 4.14 – 4.90 | Significant plaque risk. | |
| HDL (Good) | Low (Risk) | < 40 | < 1.04 | Poor reverse cholesterol transport. |
| High (Protective) | >60 | >1.55 | “Negative” risk factor (it’s good!). | |
| Triglycerides | Normal | < 150 | < 1.70 | Optimal metabolic health. |
| Very High | >500 | >5.65 | Critical Alert: Pancreatitis risk. |
2. Clinical Interpretation: Beyond the Numbers
A. The Non-HDL Cholesterol (TC – HDL)
Many clinicians now prioritize Non-HDL Cholesterol over LDL alone.
Significance: It accounts for all atherogenic particles (LDL, VLDL, IDL, and Chylomicron remnants).
Rule of Thumb: A healthy Non-HDL goal is typically your LDL target + 30 mg/dL.
B. The Atherogenic Ratios
Ratios are often more predictive of cardiovascular risk than isolated values:
TC/HDL Ratio: A ratio above 5.0 indicates high risk; the ideal is below 3.5.
LDL/HDL Ratio: A ratio above 3.0 is considered a red flag for plaque progression.
C. Understanding Dyslipidemia Patterns
Pattern A: Large, buoyant LDL particles. Generally less harmful.
Pattern B: Small, dense LDL (sdLDL) particles. These are highly atherogenic as they easily penetrate the arterial wall and oxidize. This is common in patients with high triglycerides and low HDL (the “Lipid Triad”).
3. Pathological Variations (Differential Diagnosis)
Hyperlipidemia (Elevated Levels)
Primary (Genetic):
Familial Hypercholesterolemia: Severe elevation of LDL due to receptor mutations.
Familial Combined Hyperlipidemia: Elevation of both TC and TG.
Secondary (Acquired):
Diabetes Mellitus: Insulin resistance leads to high TG and low HDL.
Hypothyroidism: Decreased thyroid hormone reduces LDL receptor activity, leading to high serum LDL.
Nephrotic Syndrome: The liver overproduces lipoproteins to compensate for low oncotic pressure.
Obstructive Jaundice (Cholestasis): Can cause massive elevations in Total Cholesterol.
Hypolipidemia (Low Levels)
Malabsorption/Malnutrition: Low TG and TC.
Hyperthyroidism: Accelerated metabolism clears lipids faster from the blood.
Severe Liver Disease: Since the liver synthesizes cholesterol, end-stage cirrhosis often presents with dangerously low lipid levels.
4. Critical Values and Lab Alerts
As a lab professional, you must be prepared to flag specific results:
Triglycerides > 1000 mg/dL: Direct communication with the clinician is required due to the imminent risk of Acute Pancreatitis.
LDL > 190 mg/dL in a young patient: May indicate undiagnosed Familial Hypercholesterolemia, requiring aggressive intervention and family screening.
5. Summary Table
| Patient Profile | Interpretation Priority | Key Lab Finding |
| Cardiac Patient | Focus on LDL & Non-HDL | Target LDL < 70 mg/dL |
| Diabetic Patient | Focus on Triglycerides | Often shows “Low HDL / High TG” |
| Acute Abdominal Pain | Focus on TG | If > 1000, suspect Pancreatitis |
| Young Adult (Healthy) | Focus on TC & HDL | Routine screening/Risk assessment |
Quick Stats
| Feature | Details | Critical Lab Insights |
| Test Type | Metabolic Panel / Lipoprotein Analysis | A foundational panel for assessing Atherogenic Risk and metabolic syndrome. Measures cholesterol transport, not just total fat. |
| Sample Type | Serum or Lithium Heparin Plasma | Gold/Red Top (Serum) is preferred. If using Plasma, EDTA can cause an osmotic shift resulting in values 3–5% lower than serum. |
| Fasting Required? | Yes (8–12 Hours) | Mandatory for accurate Triglyceride and Calculated LDL levels. Non-fasting samples show elevated chylomicrons, invalidating the Friedewald Equation. |
| Primary Metric | mg/dL (or mmol/L) | Conversion factor for Cholesterol: mg/dL ÷ 38.6 = mmol/L. For Triglycerides: mg/dL ÷ 88.5 = mmol/L. |
| The “Friedewald” Rule | LDL = TC – HDL – (TG/5) | Strict Limitation: This calculation is invalid if TG > 400 mg/dL. In such cases, the lab must perform a Direct LDL assay. |
| Biological Half-life | Varies by Lipoprotein | LDL particles circulate for approximately 2–3 days before being cleared by hepatic LDL receptors. |
| Critical Values | TG > 1,000 mg/dL | Represents a high risk for Acute Pancreatitis. Serum may appear “milky” (lipemic), which can interfere with other spectrophotometric tests. |
| Protective Marker | HDL-C > 60 mg/dL | Known as a “Negative Risk Factor.” High levels of HDL effectively “cancel out” one other cardiovascular risk factor in clinical scoring. |
| Key Limitation | Biological Variation | A single lipid profile can vary by 5–10% day-to-day due to stress, recent illness, or minor dietary changes. Two tests are often averaged for diagnosis. |
| Turnaround Time | 30–60 Minutes | While usually routine, it may be prioritized for patients in acute metabolic distress or those undergoing rapid cardiovascular screening. |
FAQs
Q1: Can we calculate LDL if the patient has not fasted?
A: No. Postprandial (non-fasting) samples contain chylomicrons, which are rich in triglycerides. This spikes the TG value, leading to an overestimation of VLDL and a falsely low calculated LDL. For accurate results, an 8–12 hour fast is mandatory unless using a Direct LDL assay.
Q2: Why is my calculated LDL negative or unusually low?
A: This typically happens when the Friedewald Equation is misused. If a patient’s Triglycerides are very high (near or above 400 mg/dL), the calculation fails. Another cause could be Type III Hyperlipoproteinemia, where the TG:VLDL ratio is not the standard 5:1. In these cases, always switch to a Direct LDL method.
Q3: What should I do if the serum sample is “milky” (Lipemic)?
A: Lipemia indicates extremely high triglycerides (usually >300 mg/dL).
Dilute the sample if the analyzer flags it as “above linearity.”
Perform an Ultracentrifugation (if available) to clear the chylomicrons.
Check for interference in other tests (e.g., Sodium, Hemoglobin, and Bilirubin) as lipemia causes light scattering that affects spectrophotometric readings.
Q4: How does Vitamin C (Ascorbic Acid) affect lipid results?
A: High doses of Vitamin C can interfere with the Trinder Reaction used in most enzymatic lipid assays. Ascorbate competes with the chromogen for hydrogen peroxide (H2O2), which can lead to falsely decreased levels of Total Cholesterol and Triglycerides.
Q5: Is it possible for HDL to be higher than Total Cholesterol?
A: In a valid physiological state, No. Total Cholesterol is the sum of HDL, LDL, and VLDL. If your results show HDL > TC, it indicates a significant analytical error, likely due to a failure in the “masking” reagent of the direct HDL assay or a sample mix-up.
Q6: Why is Non-HDL Cholesterol becoming more popular than LDL?
A: Non-HDL (TC – HDL) represents the total concentration of all potentially atherogenic lipoproteins, including LDL, VLDL, and IDL. It does not require the patient to fast and is often a better predictor of cardiovascular risk in patients with diabetes or high triglycerides.
Q7: How does pregnancy affect the lipid profile?
A: It is normal for Total Cholesterol and Triglycerides to increase significantly during the second and third trimesters (often up to 30–50%) to support fetal development. Therefore, lipid screening is usually postponed until at least 6 weeks postpartum for an accurate baseline.